Tag Archive: north carolina


In case you haven’t heard, the North Carolina General Assembly has run amok.

It’s hard to believe that things could get worse: the last NCGA approved Ammendment One, which declared that straight marriage was the only recognized family. And they tried to outlaw accelerating sea level rise by declaring that straight lines were the only recognized graph.

And yet after the 2012 election, things turned upside down.

  • Senator Tom Tucker displayed amazing arrogance and unfamiliarity with his job description when he told a reporter: “I am the senator, you are the citizen. You need to be quiet” (Huffington Post)
  • A House resolution was proposed which would allow the establishment of a state religion, as well as incorporating prayer as a public institution (WRAL)
  • Another bill was proposed to criminalize womens’ nipples. (DTH)
  • The budget committee has considered making ends meet by closing NC’s public universities (a tactic known as, ‘eating your seed corn’) (N&O)
  • The Senate has passed a bill rolling back 40 years of environmental protections in order to make way for fracking, in defiance of the state Department of Environment’s recommendations. (McClatchyDC)

That’s just some of the more bizarre social experimentation going on; there’s been plenty of garden-variety attacks on voting rights, public education and social services for the poor.

The point of all this is, a lot of people are justifiably annoyed. So much so, that weekly protests at the state capitol have broken out, headed by the state NAACP and dubbed ‘Moral Mondays’. Peaceful protesters have been arrested by the score, then the hundred, for voicing their disgust with a runaway legislature.

Conservatives have fought back, and some have fought dirty. In one especially skeezy move, the right-wing Civitas Institute has published a public database of information on the protesters, including their photograph, and city of residence. It’s creepy, but now that it exists, it’s a window into what is happening on Moral Mondays.

The Civitas data record a total of 457 arrests. Of these, all but 8 gave their residence as in North Carolina. That is to say, 98% of the arrested are clearly locals. This data reinforces an earlier survey which found the same proportion in the protesters as a whole. This matters because some, including governor Pat McCrory have tried to dismiss the protests as the work of outside agitators.

Something disappointing about the Civitas effort is that the infographics provided are drab and at times completely inappropriate. (I mean, really?)

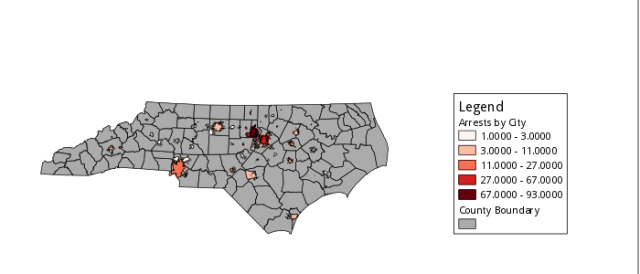
To show them how it’s done, let’s map out some information. Here are the absolute number of arrests, categorized by county and by city. Unfortunately, the city data which were available from the NC DOT did not have all of the cities in the arrest data, leading to 65 of 85 cities being represented in the map, explaining why some counties (eg, Cherokee) report arrests but contain no cities reporting arrest. This may introduce a bias in which smaller cities and towns are not represented when city-based data are used.

Words

Fig 1a. Moral Monday arrests, binned by county.

Words

Fig 1b. Moral Monday arrests, binned by city

Composite

Fig 1c. Composite map of 1a and 1b.

A few things seem to pop out: Arrests are geographically centered around the Triangle (Chapel Hill, Durham, and Raleigh), with other major centers around cities (eg, Charlotte, Wilmington, and Asheville). Comparing to other political maps (such as Amendment One or the 2012 presidential election), this pattern is not surprising, however, why it is happening is less clear.

Continue reading

I sit at the Carrboro Really Free Market, on the first caturday in July. I sit in the shade and the banners are blowing lazily in the breeze; still it’s nearly 100 degrees; the humidity jacks it up to 103, and the breeze is welcome but ineffectual. Air quality is ‘Orange’: ozone levels ‘may approach or exceed unhealthy standards.’ A parade is planned but only a handful want to move; I’m definitely not going back out. I keep a cold pack in my bag to refridgerate my computer, but I worry that the condensation from the humid air will offset the benefits of a cool processor. Whatever; I need chill tunes if I’m going to bike around in this weather.

A constant source of frustration for me is communicating the local importance of global problems. Climate change is real, and it’s serious – but at the same time it can be intangible and diffuse. I live in the North Carolina piedmont, hours away from the beach. I can explain to my neighbors that ocean acidification is a serious problem, that the demise of coral reefs would mean the loss of food and resources for the third world. But even if they believe me, even if they agree that it’s bad news, it can still be hard to see how global warming effects them personally, as a homeowner, a farmer, a pet owner or the parent of a young child, a worker with a daily commute. How does carbon dioxide pollution impact North Carolina and beyond?

rock me momma like the wind and the rain//rock me momma like a hurricane

Let’s start at the beach. An obvious problem here is rising sea levels. As the ocean heats up, it expands; as ice heats up, it melts and drains into the sea (or, it calves, falls into the sea, and then melts). This causes a slow but steady rise in sea level. Sea level is predicted to rise by a meter (maybe more) over the 21st century, and 4-6 m over the next few centuries. This is bad news bears – in many coastal counties, more than 10% of the population lives within a meter of high tide. The threat to homes and businesses is worsened by storm surges, which will also be higher as the seas rise [Strauss 2012]. North Carolina has a unique relationship with sea level rise. The coastal salt marshes have recorded 2,100 years of sea level history in their smelly mucky sediments; the ocean stayed relatively stable up until about 1880, when it began to creep upwards. The average rate of sea level rise for the NC coast over the 20th century was ‘greater than any other persistent, century-scale trend’ in the marsh’s memory. During this time period, the seas rose 3.5 times faster than they did even during the Medieval Warm Period, and regional sea level rose faster than model predictions over the 20th century (though the uncertainties involved overlap.) [Kemp et al. 2011]

Sea level rise at the North Carolina coast over the past two millenia. Things are pretty stable, even during climatic episodes like the MWP – until we get to the late 19th century. Then the hockey stick gets hockey stuck. GIA is glacial isostatic adustment, an additional factor which must be considered. It deals with the fact that the North American landmass is still rebounding from the weight of Ice Age glaciers. Image from Figure 2 of Kemp et al. 2011

But what’s really special is the state legislature’s reaction to the rising tide. This June, the NC Senate infamously outlawed the use of accelerating sea level scenarios in planning urban development. The usual astroturfing seems to be at play: the money trail for this legislation leads back to the Locke Foundation; spokespeople and nonprofits proliferate to establish a consent factory. These hijinks are as cynical as they are asinine: not only is global sea level rise accelerating [Church & White 2006], but North Carolina is at the southern end of a ‘hotspot’ where the sea is rising 3-4 times as fast as the global average, [Sallenger et al. 2012] putting its coastline at exceptional risk. The legislation is also a lovely inversion on a popular skuptik trope, that of an authoritarian scientific Orthodoxy dictating Truth and squelching dissidents. In this case, it’s the state government which has declared which climatic scenarios are kosher and which are thought crimes, favoring the least alarming. The proposed law would not merely declare what course sea level rise will take in the years to come, but also prohibit state planning agencies from considering alternatives. Not content to legislate straight marriage as the only valid relationship, the Old North State is considering straight lines as the only acceptable graph.

“You need to move indoors right now.”

– Meteorologist Dr. Forbes, on Philadelphian extreme weather.

It’s Friday night, 29 June, and forecasts of a sweltering weekend have already started to come true. I am sifting through hardware at work when the power goes out. Continue reading