In case you haven’t heard, the North Carolina General Assembly has run amok.
It’s hard to believe that things could get worse: the last NCGA approved Ammendment One, which declared that straight marriage was the only recognized family. And they tried to outlaw accelerating sea level rise by declaring that straight lines were the only recognized graph.
And yet after the 2012 election, things turned upside down.
- Senator Tom Tucker displayed amazing arrogance and unfamiliarity with his job description when he told a reporter: “I am the senator, you are the citizen. You need to be quiet” (Huffington Post)
- A House resolution was proposed which would allow the establishment of a state religion, as well as incorporating prayer as a public institution (WRAL)
- Another bill was proposed to criminalize womens’ nipples. (DTH)
- The budget committee has considered making ends meet by closing NC’s public universities (a tactic known as, ‘eating your seed corn’) (N&O)
- The Senate has passed a bill rolling back 40 years of environmental protections in order to make way for fracking, in defiance of the state Department of Environment’s recommendations. (McClatchyDC)
That’s just some of the more bizarre social experimentation going on; there’s been plenty of garden-variety attacks on voting rights, public education and social services for the poor.
The point of all this is, a lot of people are justifiably annoyed. So much so, that weekly protests at the state capitol have broken out, headed by the state NAACP and dubbed ‘Moral Mondays’. Peaceful protesters have been arrested by the score, then the hundred, for voicing their disgust with a runaway legislature.
Conservatives have fought back, and some have fought dirty. In one especially skeezy move, the right-wing Civitas Institute has published a public database of information on the protesters, including their photograph, and city of residence. It’s creepy, but now that it exists, it’s a window into what is happening on Moral Mondays.
The Civitas data record a total of 457 arrests. Of these, all but 8 gave their residence as in North Carolina. That is to say, 98% of the arrested are clearly locals. This data reinforces an earlier survey which found the same proportion in the protesters as a whole. This matters because some, including governor Pat McCrory have tried to dismiss the protests as the work of outside agitators.
Something disappointing about the Civitas effort is that the infographics provided are drab and at times completely inappropriate. (I mean, really?)
To show them how it’s done, let’s map out some information. Here are the absolute number of arrests, categorized by county and by city. Unfortunately, the city data which were available from the NC DOT did not have all of the cities in the arrest data, leading to 65 of 85 cities being represented in the map, explaining why some counties (eg, Cherokee) report arrests but contain no cities reporting arrest. This may introduce a bias in which smaller cities and towns are not represented when city-based data are used.

Fig 1a. Moral Monday arrests, binned by county.
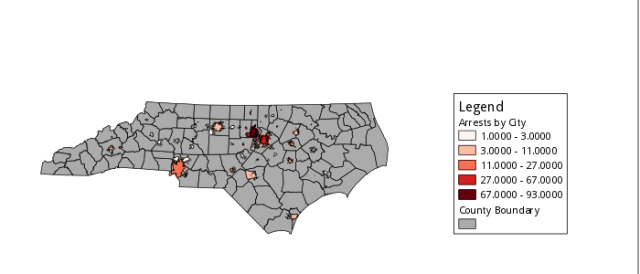
Fig 1b. Moral Monday arrests, binned by city

Fig 1c. Composite map of 1a and 1b.
A few things seem to pop out: Arrests are geographically centered around the Triangle (Chapel Hill, Durham, and Raleigh), with other major centers around cities (eg, Charlotte, Wilmington, and Asheville). Comparing to other political maps (such as Amendment One or the 2012 presidential election), this pattern is not surprising, however, why it is happening is less clear.
Continue reading →


